Analysing stock prices with Python
In this article, I will talk a little bit about how to analyze stock market shares, using Data Science. More specifically, using the Python programming language. As it is a topic that I am already familiar with, as I have investments, I decided to write this article in order to show you that it is possible to use Data Science in this segment.

Attention: this article is not an investment recommendation.
To begin, we will use the Yahoo Finance database for our project. Shall we get started? The library used in this project is pandas
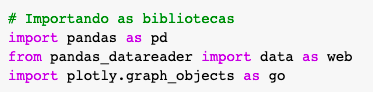
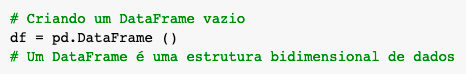
Next, we will create a DataFrame
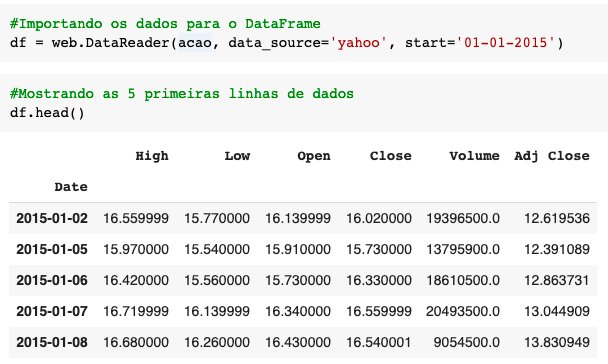
Environment ready to start the project. Now, let’s choose a stock randomly and list the first information taken from Yahoo Finance, starting in 2015.
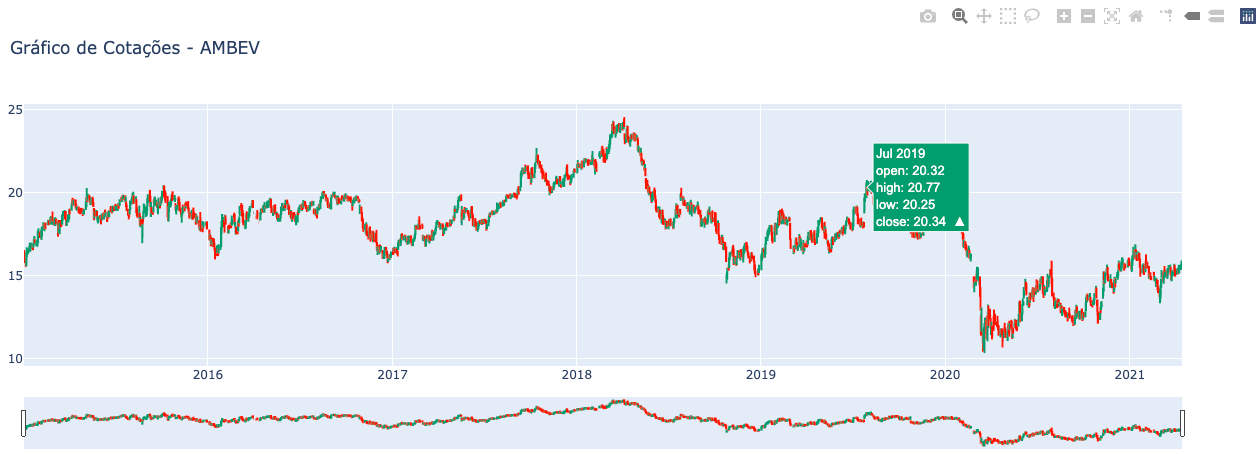
From now on, we will build graphs in order to better visualize the data, using the Plotly library. As this is an analysis of the financial market, we will use the Candlestick chart, very popular in this segment.
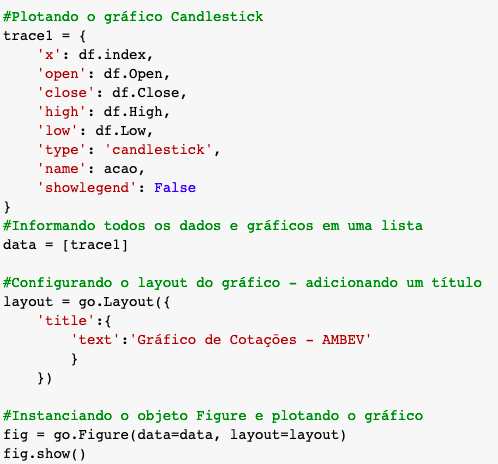
This graph has as parameters on the y-axis the opening, closing, maximum, minimum prices and, on the x-axis, the starting date.
The result:
The purpose of this article was to analyze and visualize data from an action, from the Yahoo Finance website, without the need to download large databases, using the Python language. If you want to consult the entire code, access the Notebook in this link. I hope you enjoyed it!
References: Carlos Melo