Getting insights from Telecommunications Customer Satisfaction Survey, with Python
This article aims to analyze the data available on data.gov.br, from satisfaction and quality surveys received, carried out with customers of telecommunications operators. This survey was carried out by ANATEL. As a student of Telecommunications Engineering, I decided to use Data Science to analyze the data in my area of expertise, based on the data taken from this page.

We will start preparing the environment, with the appropriate libraries for this work and uploading the data to the Notebook.
Then, we will analyze the first data of the file.
Now, let’s start our first analyzes.
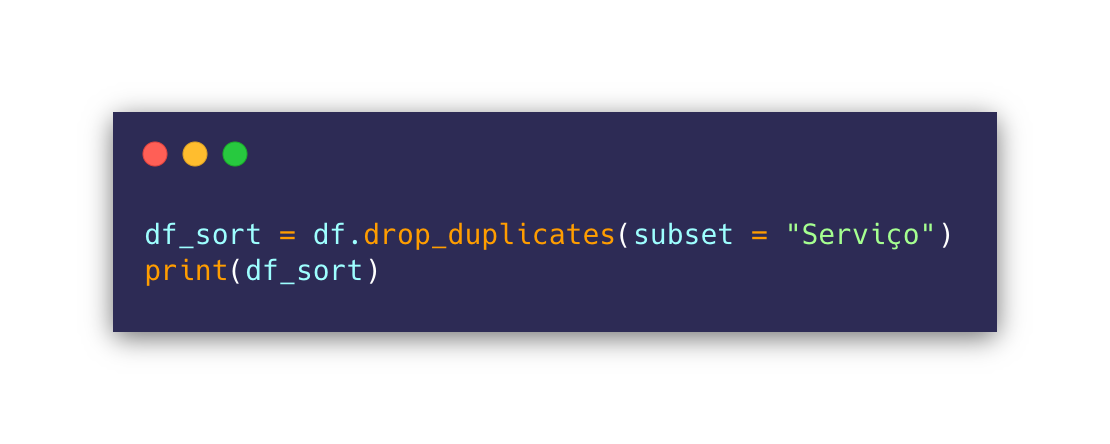
This survey carried out by Anatel took into account some different services. Let’s find out how many and what are they?
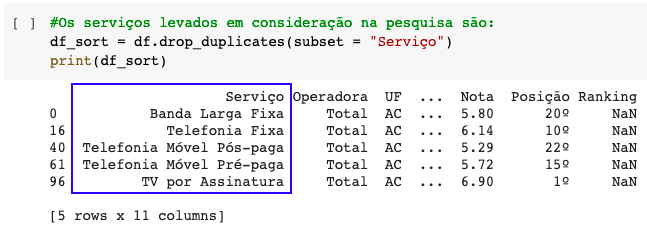
Fixed Broadband, Fixed Telephony, Postpaid Mobile Telephony, Prepaid Mobile Telephony and Pay TV Services were taken into account. What will be the average grades given by users for these services?
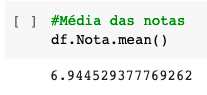
This is the overall average for all services. Note that the survey took into account some indicators, as you may have noticed when we first analyzed the data. For the purposes of individual consultation, we will choose an indicator and analyze it.
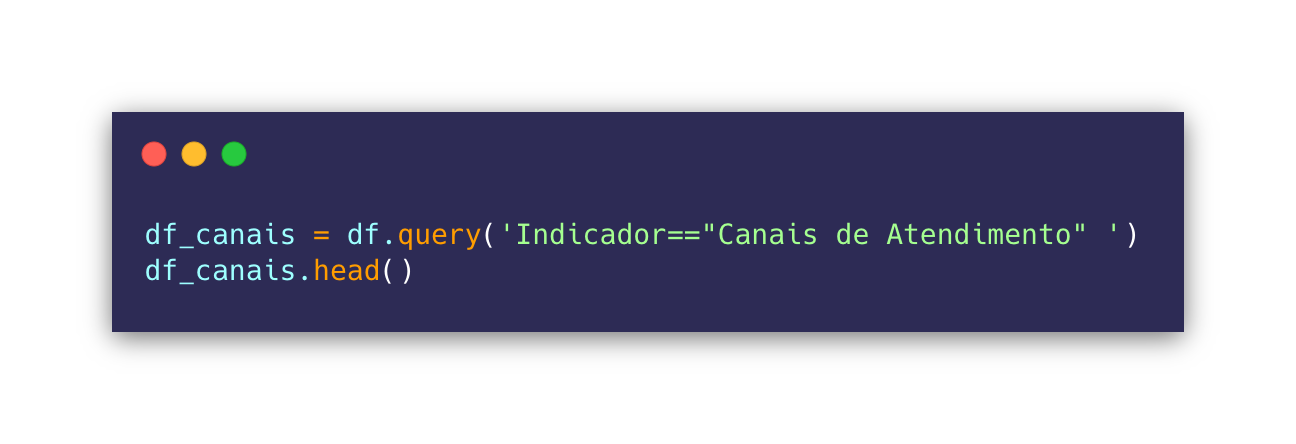
Which operator has the best Customer Service Channels, according to users?
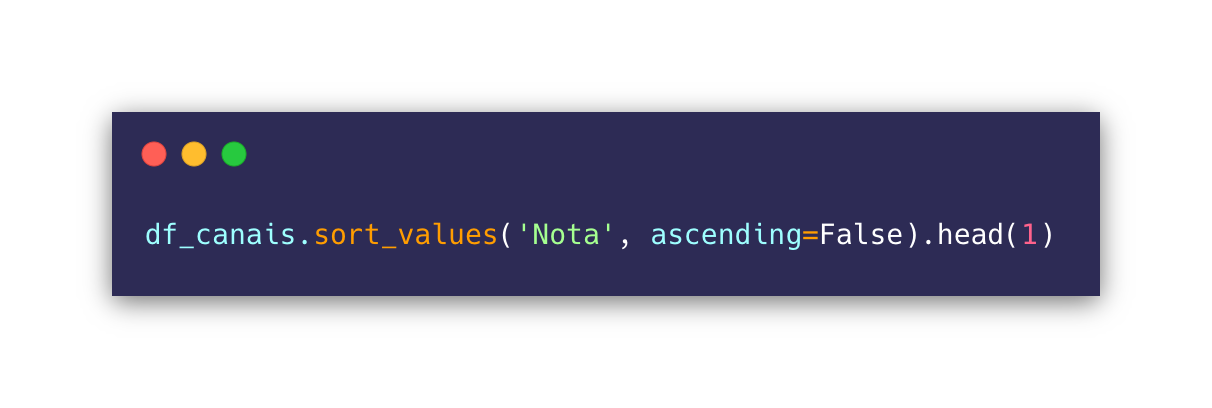

It is the operator “Nossa TV”, in the state of Rio Grande do Sul.
So far, we have obtained an overview of our data. At this point, we will move on to graphical visualizations.
We will use the library Matplotlib.
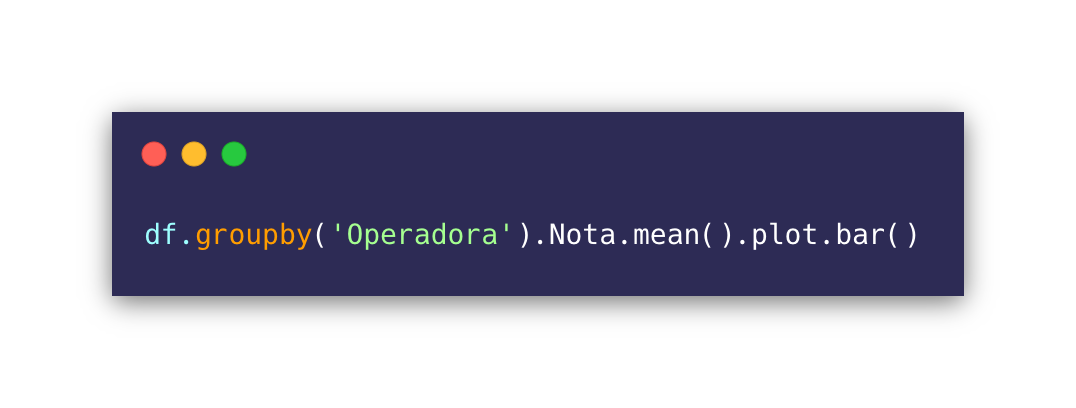
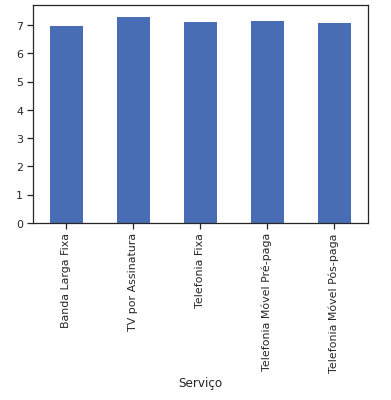
As we are using the Service Channels indicator, we will see the average of each one by operator.
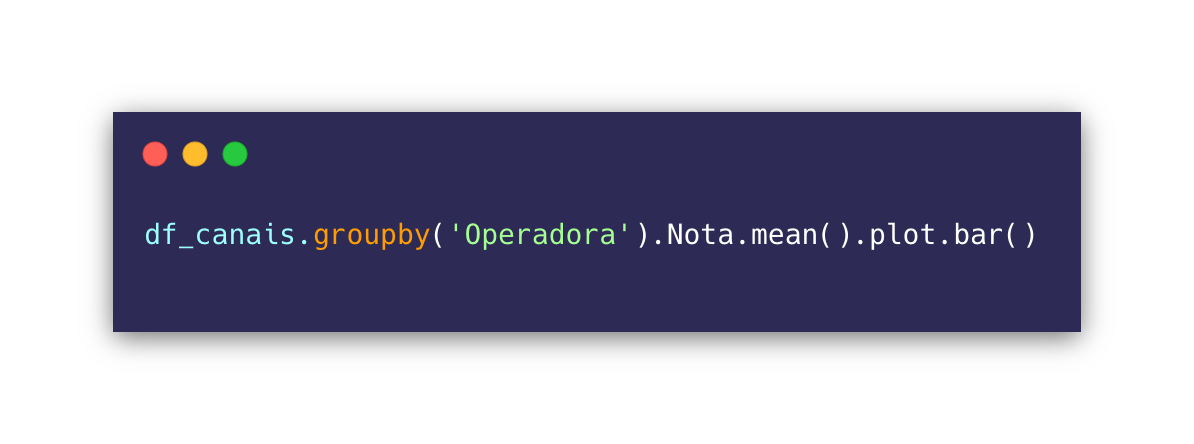
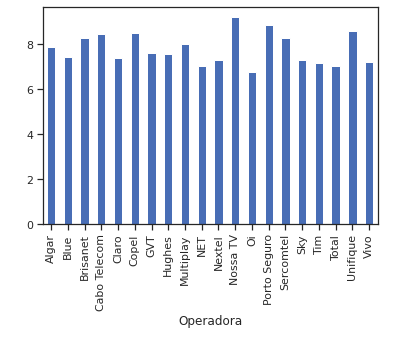
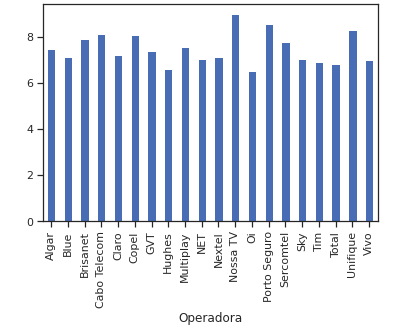
Comparing with the scores received on all indicators, we can see a certain proximity between the two analyzes.
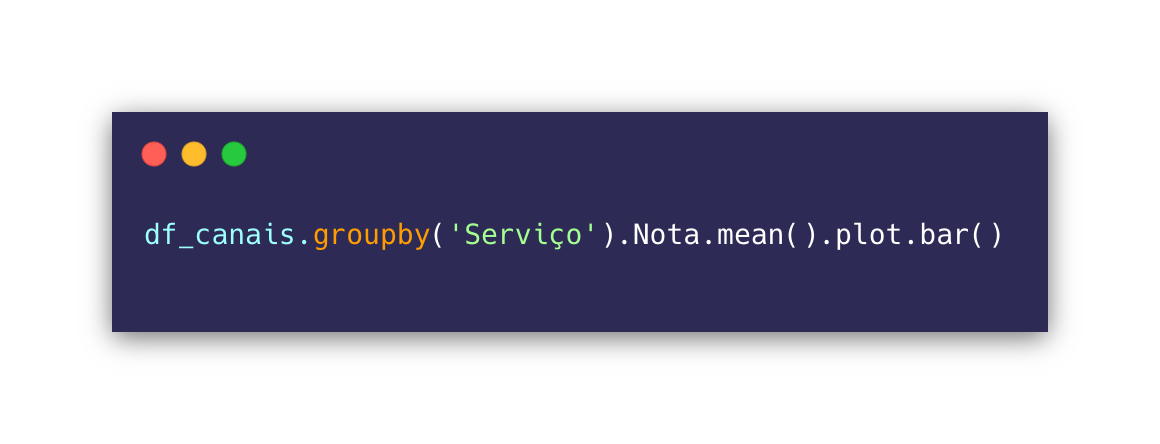
Are we going to find out the scores of the services evaluated in Customer Service Channels?
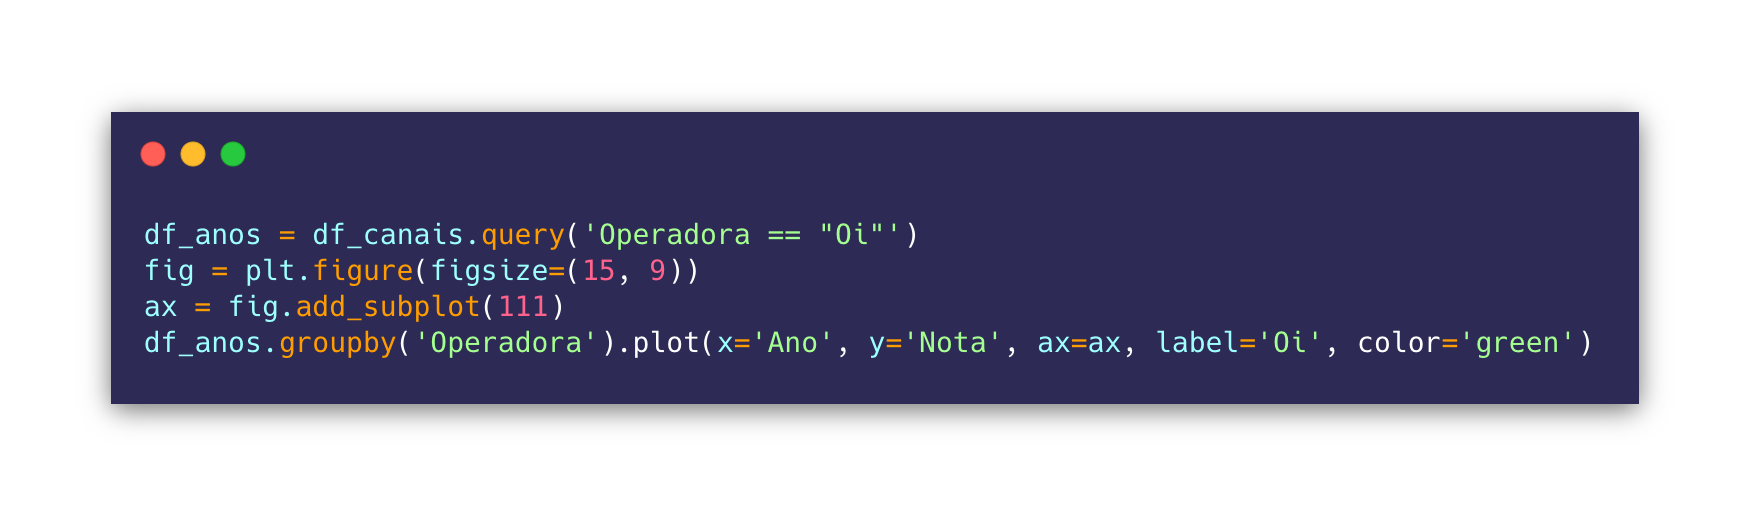
Now, we will choose an operator at random and perform an analysis between the years 2015–2020 of its Service Channels indicator.
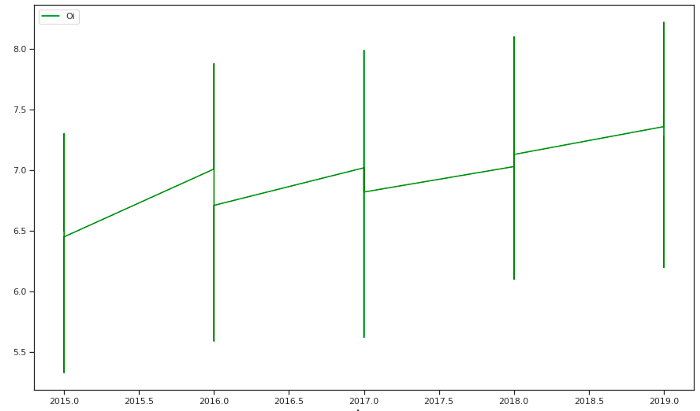
We can see an increase in the grades attributed to Oi’s Service Channels over the years, by the users of its services. Carrying out a more general analysis, we will analyze all operators over the years according to their services.
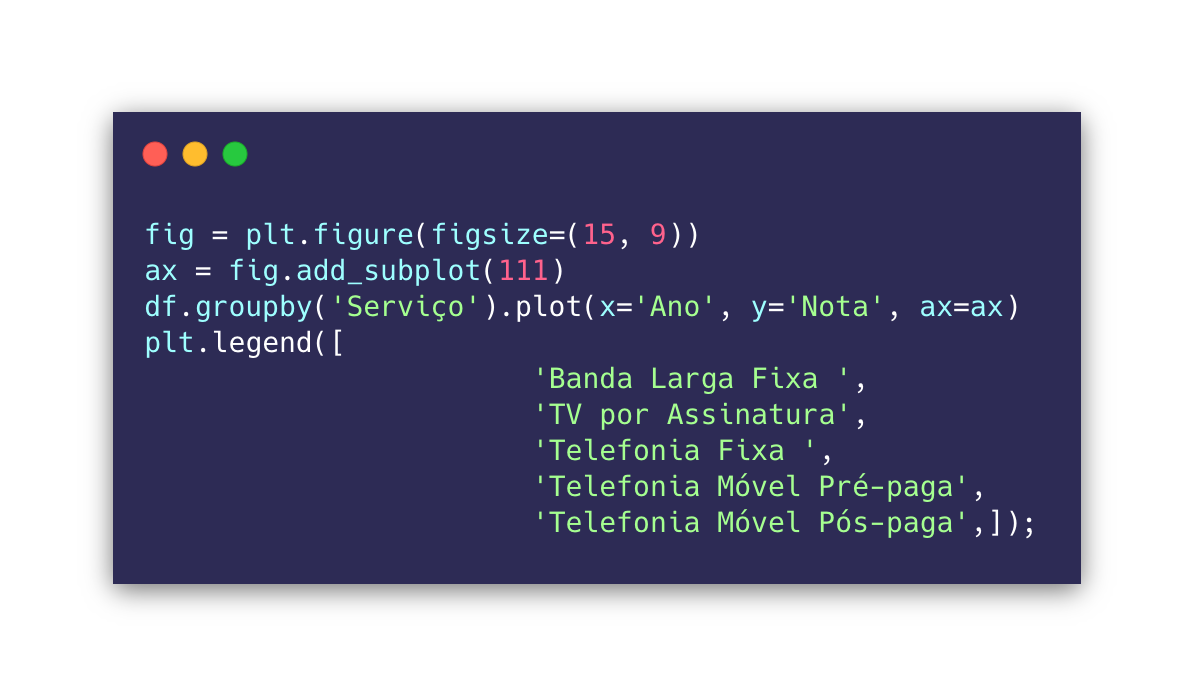
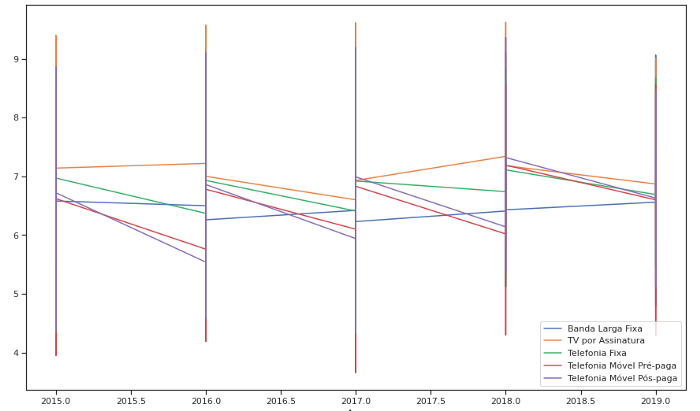
We noticed an increase in the notes of the Fixed Broadband service. On the other hand, all other services had their grades decreased between 2018 and 2019. We hope that this scenario has changed for later years.